
Last Updated: November 6, 2026
Quick Summary
Reducing returns for niche automotive parts starts with accurate Year-Make-Model fitment data, since buyers have fewer ways to confirm a match before ordering. Map every return to a coded reason, fix the top controllable causes in your listings, and track a short scorecard monthly so corrections hold.
- Niche parts return more often because buyers struggle to confirm fitment before ordering.
- Copying a supplier’s fitment file without checking it against your own returns spreads bad data.
- Photograph the connector shape, pin count, and label to settle identification questions early.
- Keep core returns in a separate bucket because they follow their own rules.
- Report returns by category and code, since low-volume SKUs hide in the total rate.
Table of Contents
- Why Niche Automotive Components Drive Returns
- Build Year-Make-Model Fitment Data You Can Trust
- Write Automotive Parts Product Descriptions That Prevent Mistakes
- Use Auto Parts Product Images to Confirm Identification
- Map the Automotive Parts Return Process for Root-Cause Analysis
- Measure and Reduce Returns with a Continuous Program
- Schedule a Demo to See Fitment and Inventory Controls in Action
- Frequently Asked Questions
Why Niche Automotive Components Drive Returns
Niche automotive parts are the specialty and low-volume components that fit only a narrow range of vehicles, and these niche automotive parts return at higher rates than common parts because buyers have fewer ways to confirm a match before ordering. According to IMR Automotive Research’s 2026 Repair Shop Challenges, 20.6% of surveyed repair shops named finding affordable parts as a challenge and 17.7% named finding the parts they need. At Blue Sage Software, we have spent more than 35 years watching how parts data drives the aftermarket, and the pattern is clear: uncertainty at checkout becomes a return at the counter.
The hidden cost of wrong-part returns
A wrong-part return costs far more than the refund. You absorb the labor to receive, inspect, restock, and resell the part. You tie up cash in inventory that sits idle. And you burn the customer’s time, which is the one cost you cannot refund.
The scale is real. AAPEX’s 2026 State of the Automotive Aftermarket Survey Report found that 38% of respondents were managing higher parts inventories, versus 20% managing fewer. More stock on the shelf means more chances for a mismatch to hide in the catalog.
- Labor: receiving, inspection, and restocking
- Cash flow: money locked in slow-moving niche stock
- Trust: a second wrong part ends the relationship
- Waste: unsellable or discounted returns
Build Year-Make-Model Fitment Data You Can Trust
Year-Make-Model fitment data is the structured record that links a specific part number to the exact vehicles it fits, and it is the single strongest defense against wrong-part returns. Get it right and most returns never happen.
Where fitment data breaks down for niche parts
Niche parts break fitment data in predictable ways. Mid-year production changes, trim-level differences, and engine variants all create gaps that generic catalogs miss. For a practical walkthrough of building YMM fitment data for obscure parts, start with the components most likely to be mis-cataloged.
Watch out: copying a supplier’s fitment file without checking it against your own returns is the most common mistake we see. Bad data propagates fast.
A 2022 study in Sustainability on return supply chains in the automotive industry notes that returns management faces broader barriers than fitment alone, so treat data quality as one layer of a larger fix. For teams mapping supplier data at scale, our guide on how to automate ACES data mapping walks through the steps.
Write Automotive Parts Product Descriptions That Prevent Mistakes
Product descriptions prevent returns when they answer the buyer’s real question: will this part fit my vehicle? Write for the person holding a VIN, not for a search engine.
- Lead with the exact fitment range
- Name the part number and any superseded numbers
- Call out trim, engine, and drivetrain limits
- State what the part does not fit
A common mistake is burying fitment details below marketing copy. Put them first. Buyers who cannot confirm a match guess, and guesses come back. Our article on minimizing automotive parts returns through data accuracy covers how cleaner data cuts wrong-part orders before they ship.
Use Auto Parts Product Images to Confirm Identification
Auto parts product images confirm identification when they show the actual part from multiple angles, including connectors, mounting points, and any stamping or casting marks. A single stock photo is not enough for a niche component.
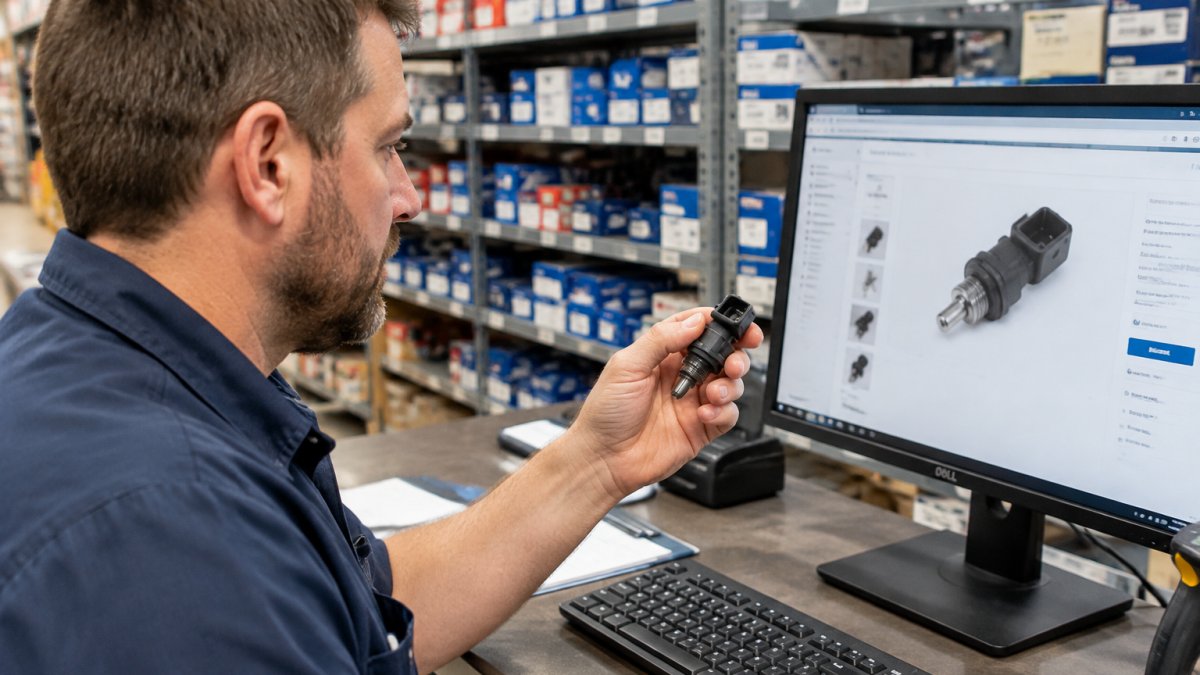
Photograph the connector shape, the pin count, and the label. Those three details settle most identification questions before an order is placed. Poor images are a leading cause of buyer confusion in online parts sales.
Map the Automotive Parts Return Process for Root-Cause Analysis
The automotive parts return process should be mapped step by step so every return produces a reason code, not just a credit. Without that structure, you fix symptoms and miss causes. For niche components the stakes are higher: a single mis-coded return on a low-volume SKU can hide a catalog error that will repeat for months, because there are too few transactions for the pattern to surface on its own.
Build a return-reason taxonomy that separates causes
A return-reason taxonomy is a fixed list of coded reasons that lets you group returns and find the pattern behind them. Keep it short, specific, and stable, changing codes mid-year destroys your trend line. The most useful split is between causes you control and causes you do not, because only the first group belongs in a corrective-action queue.
| Code | Return Reason | Cause Type | What It Signals | First Fix |
|---|---|---|---|---|
| F1 | Wrong fitment, catalog error | Controllable | Bad Year-Make-Model data | Audit the listing against the supplier file |
| F2 | Wrong fitment, customer misorder | Controllable | Unclear description or fitment copy | Rewrite fitment range and exclusions |
| F3 | Wrong part shipped | Controllable | Pick/pack or bin error | Verify bin location and scan at pack |
| D1 | Shipping damage | Controllable | Weak packaging | Add corner protection and inner cushioning |
| D2 | Defective part | Supplier | Vendor quality escape | Flag the vendor and open a claim |
| C1 | Changed mind | Policy | Buyer preference | Review return terms and restocking policy |
| C2 | Ordered multiple to compare | Policy | Fitment uncertainty at checkout | Add identification support before order |
| R1 | Core return | Separate bucket | Core exchange, not a failure | Track on its own cycle |
Core returns follow their own rules, so keep them in a separate bucket. Our guide on managing automotive core returns covers those best practices. Parts inventory management also helps you spot which niche SKUs generate the most returns and adjust stock accordingly.
Run root-cause analysis on the top codes, not the total
A raw return rate tells you something is wrong; a coded return tells you what. Pull the top three codes each month and trace each one back to a specific listing, bin, or supplier batch. Use the same application checks on incoming supplier batches to confirm every part fits before its listing goes live, so a corrected description does not simply shift the mismatch upstream.
Watch out: coding returns by the customer’s stated reason alone will mislead you, because buyers often say “doesn’t fit” when the real cause was a shipping dent or a missing harness. Have the receiving team confirm the physical cause before the code is closed.
Close the loop from return to catalog
A root-cause analysis only pays off if the finding reaches the people who can change the data. Assign each controllable code an owner, catalog, warehouse, packaging, or customer support, and require a written corrective action before the return is closed. Feed the result back into fitment data, product images, and parts inventory records so the same niche component does not return twice for the same reason.
Measure and Reduce Returns with a Continuous Program
Reducing returns for niche automotive components works best as a continuous program with a small set of tracked metrics, not a one-time cleanup. Pick your numbers, set a baseline, name an owner for each, and review them on a fixed cadence so you can tell whether an intervention actually worked.
Set a baseline before you change anything
You cannot prove a fix worked without a starting point. Pull twelve months of return data by SKU and by reason code, then calculate a return rate for each niche category as returns divided by units shipped. Low-volume categories can swing widely month to month, so a rolling three-month average is often more useful for niche parts than a single month. Record the baseline date and the exact definition you used; if you change the definition later, you lose the comparison.
Track a short scorecard with owners and targets
Keep the scorecard small enough that someone actually reviews it. A workable set for a niche-parts operation:
- Return rate by part category, owner: category manager; target: a stated reduction against the rolling baseline, reviewed monthly.
- Top five return reasons each month, owner: returns lead; target: no single controllable code rising month over month.
- Fitment-related returns as a share of total, owner: catalog team; target: a declining share as listings are corrected.
- Supplier data error rate, owner: purchasing; target: fewer rejected or corrected supplier records per intake batch.
- Repeat-return SKUs, owner: inventory planner; target: zero SKUs returning for the same code twice in a quarter.
Parts inventory management is where the repeat-return metric lives, because it ties a SKU’s return history to its stock position and lets you decide whether to fix the listing or stop carrying the part.
Set a review cadence and act on the worst performers
A monthly review is enough for most operations: compare the scorecard to the baseline, pick the two worst-performing SKUs or codes, and assign one corrective action each with a due date. Quarterly, step back and ask whether the program itself is working, if the fitment-return share has not moved after two quarters of listing fixes, the problem is probably upstream in supplier data rather than in the listings.
Demand is not slowing. Boston Consulting Group’s 2026 Global Automotive Supplier Study expects automotive component demand to grow around 3.5% annually from 2025 to 2035, so the return volume tied to that growth will grow with it. A program that catches root causes early keeps costs flat as volume rises.
Watch out: a program that only reports the total return rate will hide the niche SKUs that matter most, because their volume is too small to move the aggregate. Report by category and by code, not just overall.
Schedule a Demo to See Fitment and Inventory Controls in Action
Blue Sage Software builds ERP, POS, and inventory management for the automotive aftermarket, with flexible on-premise or cloud-based deployment for multi-store operations.
If you deal in obscure parts and specialty vehicles, fitment coverage is the question that matters most. Our platform brings together parts inventory management and eCommerce storefronts in one integrated suite. Before you book, read what to evaluate in an automotive parts store software demo so you ask the right questions.
The returns problem will not fix itself as niche demand grows. Blue Sage Software gives you the fitment data, inventory controls, and multi-store visibility to catch wrong-part orders early, backed by more than 35 years in the automotive aftermarket.
Frequently Asked Questions
Why are automotive parts returned so often?
Fitment mistakes are the biggest driver. Buyers order a part that looks right but does not fit their exact vehicle, especially with niche components that vary by trim, engine, or production date. Weak product data and unclear images make the problem worse. Returns management often faces broader barriers beyond fitment alone, so it needs a process, not just better listings.
How does accurate Year-Make-Model fitment data prevent returns?
Year-Make-Model fitment data ties each part number to the exact vehicles it fits, so buyers and counter staff can verify vehicle compatibility before ordering. For niche components, the data must go beyond year, make, and model to include engine, trim, and production splits. When the fitment record is complete and current, wrong-part returns drop because the buyer sees a confirmed match instead of guessing.
What information should an automotive parts product description include?
Include the part number, interchange numbers, vehicle application notes, dimensions in metric where relevant, material, and any installation caveats. For niche components, add notes on common misidentifications and which similar parts it does not replace. Clear automotive parts product descriptions reduce buyer confusion and give customer support a shared reference when a question comes in before purchase.
How should a parts retailer handle a fitment-related return?
Log the return reason against a taxonomy that separates fitment error, damaged shipment, wrong part shipped, and buyer remorse. Inspect the part and confirm the fitment record. Then feed the finding back to the catalog or supplier so the listing is corrected. A structured automotive parts return process turns each return into a data point that prevents the next one, rather than a one-off credit.
